Visual Analysis
Fitted Model
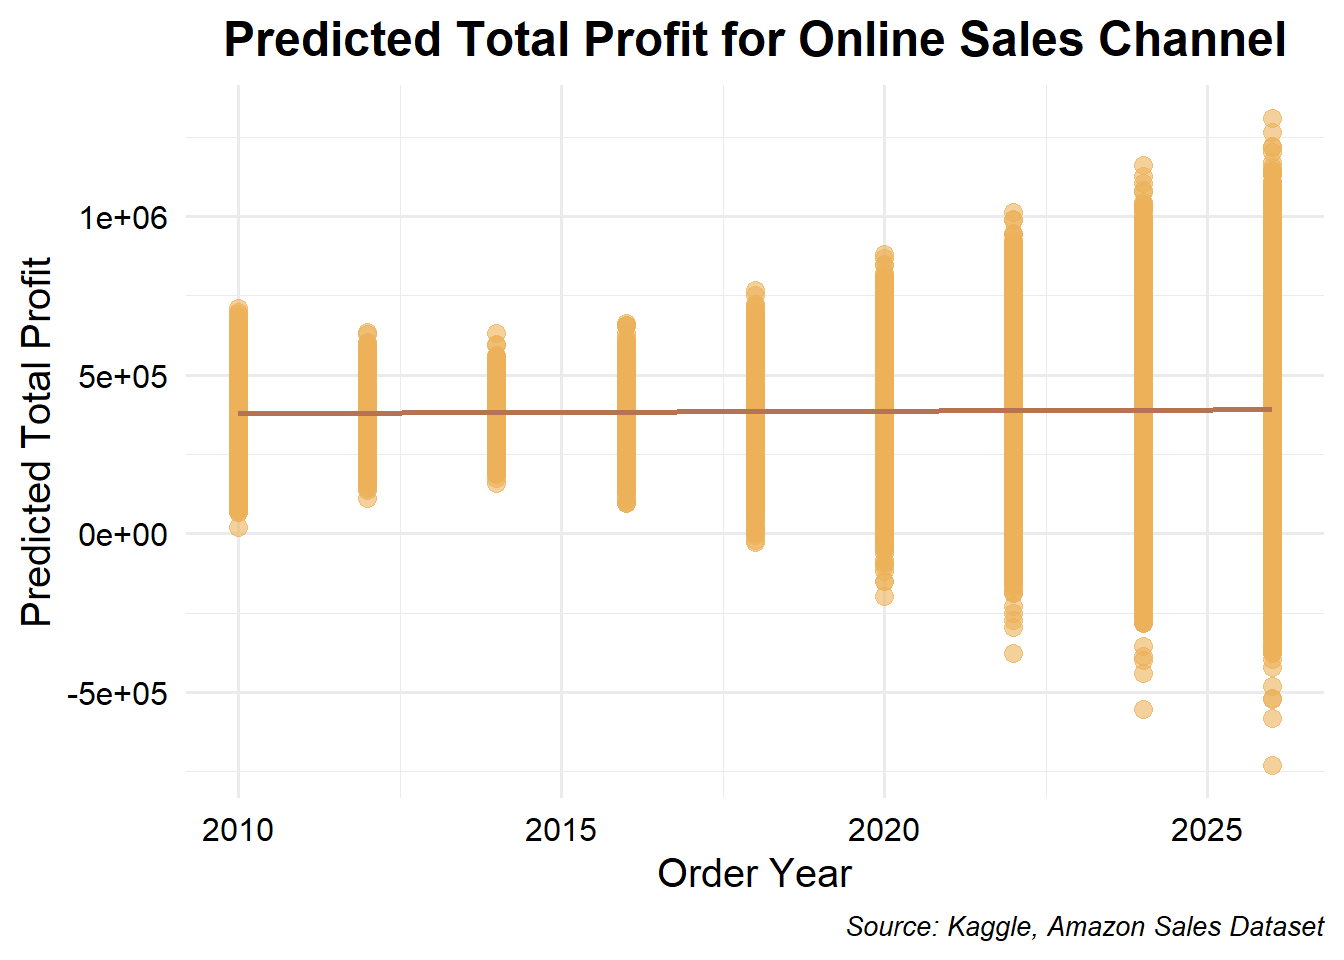
This graph visualizes the predicted total profit over different order years for online sales, showing the trend based on Bayesian regression analysis. The points represent individual predictions, and the smooth line indicates the general trend over time, highlighting an overall pattern in the online sales channel.

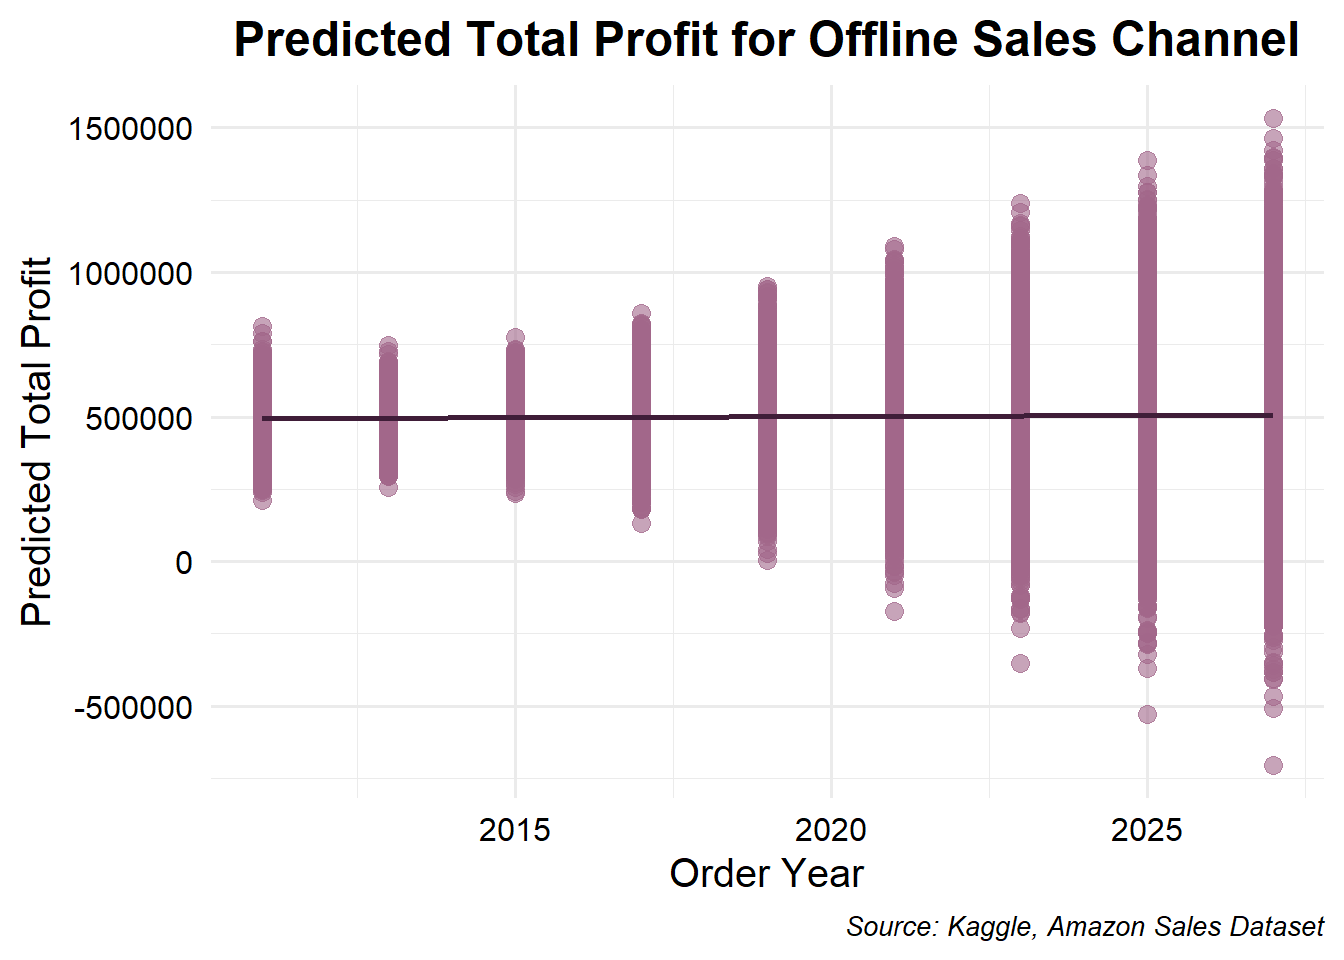
The graph shows the predicted total profit for offline sales over various order years, derived from a Bayesian regression model. The individual points represent specific predictions for each year, with the color and size highlighting their distribution. The smooth line provides an overall trend, showing how total profits in the offline sales channel have changed over time.
Central Question
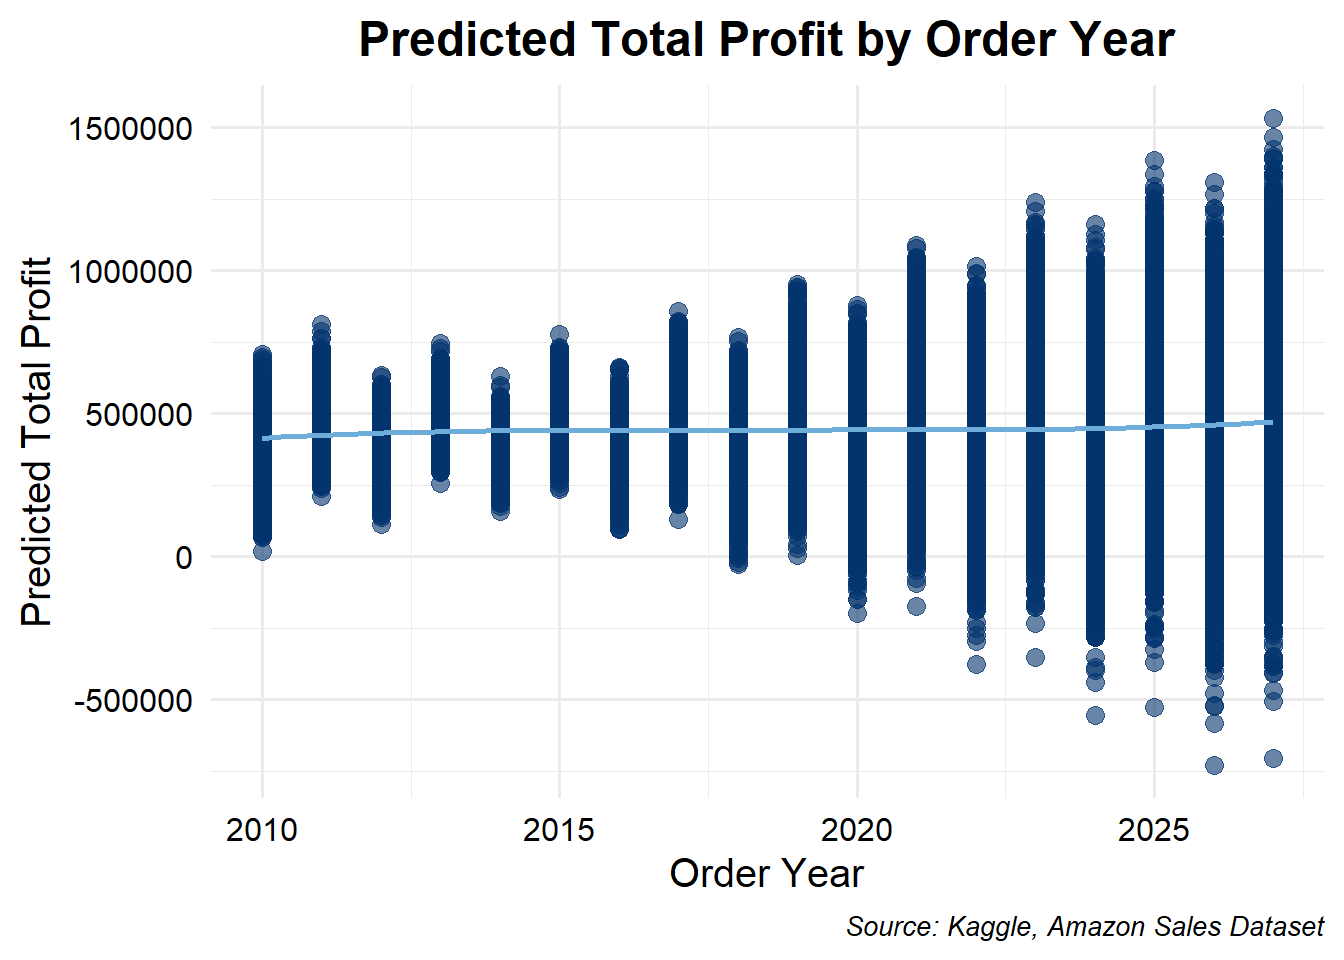
The plot below will answer our general/central question which is, how the profit increasing trend would be during upcoming years for both sales channels.

Graph Explanation
The plot visualizes the predictions from a Bayesian regression model where total profit is modeled as a function of order year using a Gaussian distribution. The blue points represent the model’s predicted profits for each year from 2010 to 2026, while the red LOESS curve smooths these predictions to reveal the overall trend. The plot, with its clear axis labels, centered title, and styled caption, suggests how the model expects total profit to evolve over time, providing valuable insights into potential profit trends and helping guide future business decisions.
Quantitative Analysis
Characteristic |
Beta |
95% CI 1 |
|---|---|---|
| Order_Year | 764 | -39,321, 42,843 |
| Sales_Channel | ||
| Sales_ChannelOnline | -114,969 | -294,935, 58,348 |
| 1
CI = Credible Interval |
||
Formula
\[ TotalProfit_i = \beta_0 + \beta_1SalesChannel + \beta_2OrderYear + \epsilon_i \]
Explanation of regression table
The regression results provide an insight into the relationship between the predictor variables—Order Year and Sales Channel—and the predicted Total Profit. The estimated coefficient (Beta) for Order Year is 764, with a 95% Credible Interval (CI) ranging from -39,321 to 42,843. This wide interval, which includes zero, suggests that the effect of Order Year on Total Profit is uncertain, indicating no clear evidence of a positive or negative trend over time.
For the Sales Channel variable, the category Online has an estimated coefficient of -114,969 with a 95% CI of -294,935 to 58,348. This suggests that, on average, online sales may be associated with a decrease in Total Profit compared to the baseline (likely offline or another sales channel), but the large interval again includes zero, indicating considerable uncertainty.
Posterior Perdictive Check
